by Loren Cobb
21 March 2002
The “Arezi Ratio” is the ratio of the rate of return of cash to the rate of return of SPX, the S&P 500 stock index. When cash has a high return compared to SPX, then the market is likely to correct downwards. Contrariwise, when cash has a low return compared to the SPX, then the market is likely to correct upwards. The idea for the Arezi Ratio was first introduced to the Mechanical Investing board by Arezi, in post #97675. In discussions on that board it became known as the Arezi Ratio, even though the idea has been reasonably well-known in the financial community for years. Here is a link to Arezi’s first post on the topic, which is also reproduced at the end of these notes:
In practice, the rate of return of cash is conveniently estimated by the yield of the 3-month Treasury bill. Estimates for the rate of return of SPX are available from various sources. This rate of return is usually computed as the sum of the trailing 12-month earnings for all the stocks in the index, divided by the price of the index. There has been some debate on whether to use trailing earnings, estimated current earnings, or projected future earnings in the Arezi Ratio (henceforth AR), and the consensus seems to have settled on the most reliable number, the 12-month trailing earnings.
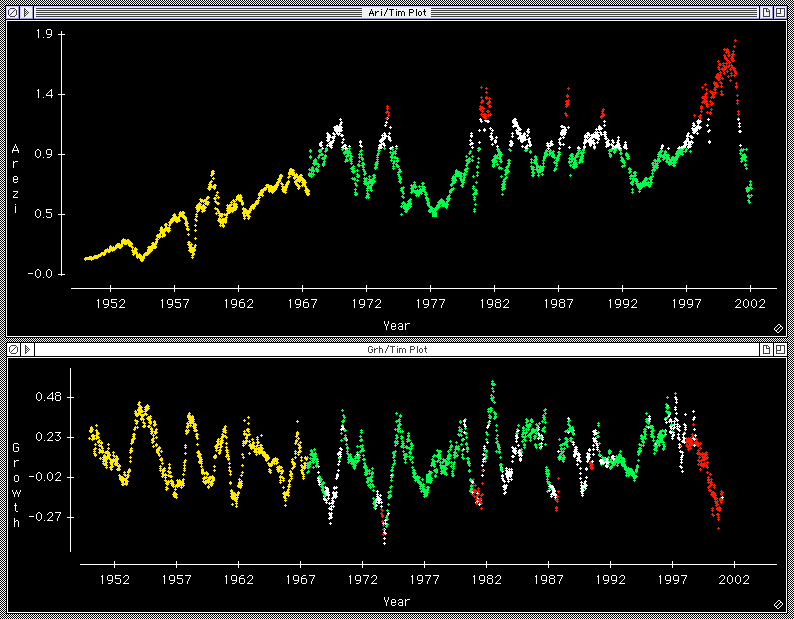
Thanks to Volki, we have weekly data on AR going back into the 1940s, calculated from source materials from Pinnacle Data (and posted with their permission). I was able to obtain weekly Yahoo data for the SPX going back to 1950, from which I calculated the forward annual growth rates. Here are the two time series:

The growth time series looks quite stationary, but AR exhibits an increasing trend over time. Arezi explained the secular trend to me as follows:
The secular trend in AR causes a problem for predicting growth, because the latter has no trend. One solution that has been proposed is to subtract the trend from the AR series. I personally do not like this solution, because it implies that the trend will continue indefinitely into the future. Instead, I see the period marked in yellow in the above charts as a special period during which time investors were adjusting to the new post-war and post-depression reality. This period of rising AR seems to come to an abrupt end on 30 June 1967, at which moment the AR series gaps upwards and from then on maintains a pattern of fluctuations around a constant mean. Therefore, it would seem appropriate to select for analysis only the post-1967 data.
We can test the ability of the Arezi Ratio to predict growth in the SPX by many meth-ods. Perhaps the simplest is merely to look at the scatterplot of these two variables. This scatterplot is shown in Figure 2 below. Each point in the scatterplot represents one week between the years 1967 and 2000. The x- and y-coordinates of the point are Arezi Ratio for that week, and the forward-looking annual growth rate in the SPX, respectively. Note that the cloud of points is oriented along a line from upper-left to lower-right, indicating that higher values of AR are associated with lower annual growth rates.

Figure 2: Scatterplot of SPX Annual Growth Rates versus the Arezi Ratio.
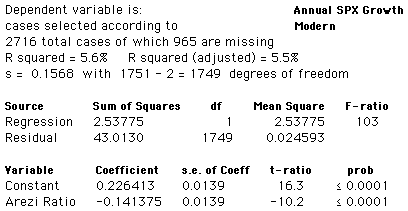
The actual line drawn through the scatterplot was calculated using linear regression, which finds the straight line that best fits the cloud of data points, according to the least-mean-squared-error criterion. The regression analysis for this line is reproduced below:

The regression is statistically significant, which in this case means very little. Of more interest are the actual coefficients themselves, since these are what we use to predict annual growth in SPX from the Arezi Ratio. The prediction formula for growth, expressed as an annual percentage rate, is this:
The white line in Figure 2 shows these predictions. One cannot help but observe that there is a lot of error involved here. In fact the Arezi Ratio accounts for only 5.5% of the variation in SPX growth rates, and the standard deviation of the error for any one prediction is about 15.7%. Although this is a lot of error, it is also quite clear from the scatterplot that when AR < 1, i.e. the points that are colored green, the SPX growth rate will very often be positive, and sometimes very high indeed. On the other hand when AR > 1.25, i.e. the points colored red, SPX growth is much more likely to be negative.
It is worthwhile asking of any proposed predictor just how far into the future it can see. In the case of the Arezi Ratio, we can check its ability to predict SPX growth over any interval measured in weeks. The F-ratio for the regression analysis will reach a maximum when the predictor is doing the best it possibly can. Here is a table showing the F-ratio for predicting growth over specified numbers of weeks. It achieves its maximum predictive ability at 48 weeks.
| Weeks | 4 | 8 | 12 | 16 | 20 | 24 | 28 | 32 | 36 | 40 | 44 | 48 | 52 | 56 | 60 |
| F-ratio | 32.8 | 49.9 | 62.7 | 70.8 | 77.6 | 81.0 | 84.8 | 89.7 | 91.5 | 99.3 | 106 | 108 | 103 | 99.6 | 92.8 |
Since an interval of 48 weeks is quite close to a year, and the F-ratio for one year is still quite close to the maximum, I have elected to keep things simple and just use the year as the natural distance into the future for growth predictions based on the Arezi Ratio.
I also looked for a lower threshold, below which all weeks have the highest empirical mean growth rate. This lower threshold was found at about 1.00; all weeks below the AR = 1.0 mark had a mean annual return of 12.7% for SPX. These points are colored green.
In his original post on this ratio, Arezi writes that he uses AR to decide when to reduce or increase exposure to the stock market. It's interesting to look at the last 50 years of the SPX, colored according to the thresholds described above. This graph is shown in Figure 3 below, using a logarithmic scale. It's striking how the AR was showing a clear danger signal throughout the great speculative bubble, from February of 1998 through January of 2001. It also correctly called three previous downturns, but would have failed to adequately warn investors of the downturn of 1973-74.

From post #97675 on the Mechanical Investing Board:
|
... A simple application of that idea would be to do this. Compare the yield of cash to the SPX earnings yield. The SPX earnings yield is simply the ratio of estimated earnings for all stocks in SPX divided by the price of the index at that time. Use that in the denominator of a ratio, the numerator of which is the yield on cash, the proxy for which is the 3-mo tbill yield. When that ratio is over 1.25, reduce exposure to stocks. When it's under 0.75, increase exposure. How much you do of either depends on your personal risk perferences and how much you wish to avoid or embrace risk. Personally, I look for stocks to short when the ratio is too high and, conversely, buy stocks on margin when it gets too low. But I take more risk than most. The above relative value ratio has actually had a gradually rising secular trend over the past 50+ years. So a more sophisticated application would be to do a regression of that trend over the past 50 or so years and measure deviations from the trend in std dev. I mentioned this idea to a friend of mine recently, and he sent me a beautiful chart of this ratio covering the past several decades. For lack of graphics capability here I cannot post it, but I recommned that anyone interested in this idea calculate it and look at it for yourself. I have been using this idea for quite some time and have been quite pleased with it. Perhaps you will find it helpful too. It's certainly better than an arbitrary fixed allocation. arezi |