 |
Loren Cobb
There is a question that arises over and over among people who try to use quantitative analysis to predict stock price behavior: "Why do all forms of multiple regression analysis seem to perform so badly when applied to stock price predictions?" This essay presents my answer this perennial puzzle.
Some analysts focus on the temporal history of just one stock, attempting to find the best fitting formula that will predict its growth rate from its measured characteristics. Others expand their horizons to carefully defined homogeneous groups of stocks, or to broad segments of the market, or to the entire market. Some use linear models, some rank- or log-transform their independent variables in order to reduce the effects of non-linearity and non-normality, while still others develop elaborate and sophisticated non-linear models. Regardless of the simplicity or sophistication of the specific method employed, they all encounter the same experience: miserable failure.
Having experienced this phenomenon first hand and thought about it at length, I believe that there is one single important reason for this failure: in multi-stock analyses, the number of stocks that actually grow substantially almost always turns out to be small compared to the total number of stocks in the group, and form an extreme set. Similarly, in single-stock analyses, the proportion of the time that a stock grows at a rapid rate almost always turns out to be small compared to the length of its historical record, and these high-growth time segments are extreme with respect to some key variables. In either case, the interesting "high-growth" portion has too little leverage in the regression analysis to account for very much at all, and the extreme cases are too easily missed.
So how is it that some quantitative investors can consistently pick out winners?
There is a quantitative alternative to regression analysis: search for stocks within a segment that occupy extreme positions with respect to one or more variables, in the hope that these extreme stocks will also exhibit unusual growth characteristics. For example, one could look within the segment of small capitalization stocks with positive recent growth and earnings for those particular stocks that have the greatest growth rates. This general technique is called “screening.” As a matter of general experience, it seems to work far more effectively than any form of regression analysis.
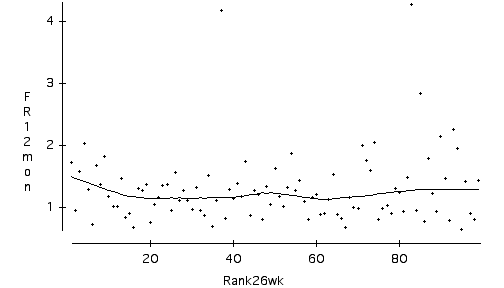
Why does screening work, when sophisticated regression methods fail? I believe that it works because the price of a stock that is extreme in certain important respects will behave differently from the multitudes of ordinary stocks. For example, here is a chart from April 1990, showing the one-year future return of the 100 stocks in the Value Line universe with Timeliness = 1. The horizontal axis is the ranked returns over the previous six months. The line through the scatterplot is generated by a Lowess smoothing algorithm. Note that the stocks with the very highest ranked returns (on the left) show an increasing trend in future return with higher rank. A screen that picked out the top 5 or 10 stocks with respect to previous six-month return would have been very profitable, had those stocks been held for one year.
 |
On the other hand, if a quantitatively-oriented investor had analysed the same dataset with multiple regression, he or she would have found no statistically significant effects. The regression of 12-month future return on any or all previous returns, ranked or not, yields nothing. The same is true for 1-month, 3-month, and 6-month future returns. The same is true if each of these future returns is regressed against all available past returns. There is nothing to be found with regression: nada de nada, gar nichts, rien du tout, zippo.
Suppose that we were supermen who could visualize space in any number of dimensions, not just the conventional three. Then we could “see” stock growth potential as a function of many different variables simultaneously. This function would like look a surface, and our task as investors would be to find the highest point on the surface. Not being supermen, alas, our ability to visualize this hypersurface of growth potential is sadly constrained. At best we can see one three-dimensional section of the surface at a time. Each such section looks something like the figure below. In the middle of the figure, representing stocks of average characteristics, we expect to see average growth. Moving out along any chosen characteristic, we may find that the stocks out at very extreme have much different growth rates.
 |
In any case, the optimum will lie somewhere along the boundary of the figure. Our task is to move from the middle out to the boundary in steps that will take us to somewhere near the optimum. Screening works because it does exactly that: by sorting our set of stocks according to a variable and then focusing on the extreme cases in the sort, we have moved our focus towards the boundary of the surface, along the dimension that corresponds to the variable on which we did the sort. This is where we are likely to find superior stock growth.
To summarize, regression analysis is adept at finding a trend, if one exists, but only when the trend extends across a large proportion of the data. The reverse is typically true for the growth rate of stock prices: the trend is only visible at the very extremes. Therefore a filtering technique like screening, which naturally focuses on the extremes, should consistently outperform the usual type of regression analysis, which tries to find a linear trend over the entire dataset.